> ## Documentation Index
> Fetch the complete documentation index at: https://docs.getstrada.com/llms.txt
> Use this file to discover all available pages before exploring further.
# Managing Your View
> Resize, rearrange, edit, and manage charts on your analytics view
## Dashboard Layout
Your dashboard is a flexible canvas. You can arrange and resize charts however you like to build the perfect overview.
### Rearranging Charts
Drag any chart by its title bar to move it to a new position on the dashboard. Other charts automatically reflow to make space.
### Resizing Charts
Hover over the bottom-right corner of any chart and drag to resize it. Charts snap to a grid, so they'll always align neatly.
***
## Chart Actions
Right-click any chart (or click the menu) to see available actions:
 ### Edit
Opens the chart builder with the chart's current SQL, configuration, and settings pre-loaded. Make your changes and click **Save Chart** to update. You can also use **[AI Query](/logs/analytics-custom-charts#using-ai-query)** to iterate on the chart with natural language.
### Duplicate
Creates a copy of the chart on your dashboard. The duplicate has the same SQL and configuration. Useful when you want a variation of an existing chart without starting from scratch.
### Delete
Removes the chart from your dashboard. You'll be asked to confirm before it's deleted.
### Export CSV
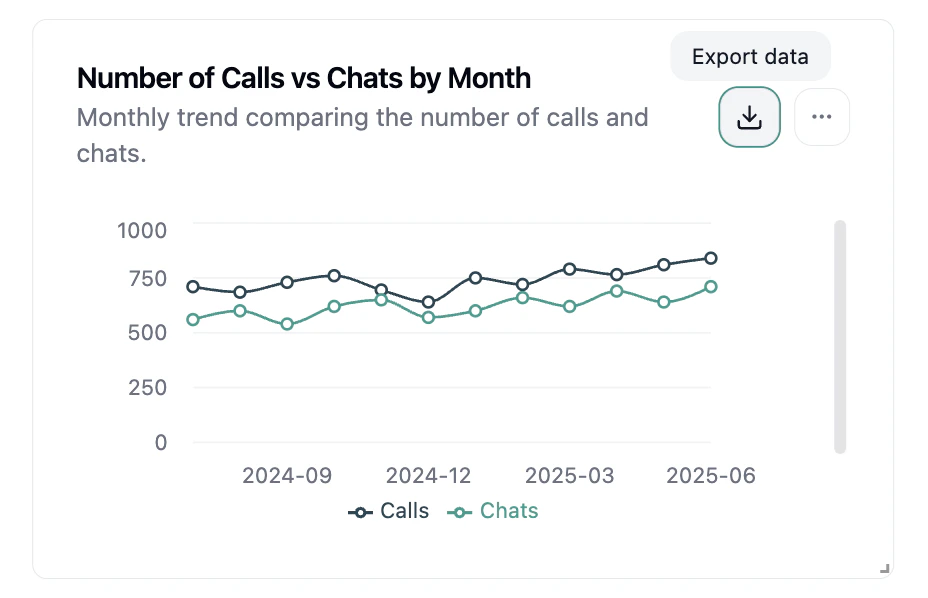
Click the **Download** button on any chart to export its data as a CSV file.
### Edit
Opens the chart builder with the chart's current SQL, configuration, and settings pre-loaded. Make your changes and click **Save Chart** to update. You can also use **[AI Query](/logs/analytics-custom-charts#using-ai-query)** to iterate on the chart with natural language.
### Duplicate
Creates a copy of the chart on your dashboard. The duplicate has the same SQL and configuration. Useful when you want a variation of an existing chart without starting from scratch.
### Delete
Removes the chart from your dashboard. You'll be asked to confirm before it's deleted.
### Export CSV
Click the **Download** button on any chart to export its data as a CSV file.
 ***
## Editing Existing Charts
To modify a chart that's already on your dashboard:
1. Right-click the chart (or click the menu) and select **Edit**.
2. The chart builder opens with your existing query and configuration.
3. You can change the SQL, switch [chart types](/logs/analytics-custom-charts#chart-types), adjust configuration, or use [AI Query](/logs/analytics-custom-charts#using-ai-query) to iterate.
4. Click **Save Chart** to apply your changes.
If you want to experiment without risking your current chart, use **Duplicate** first. Edit the copy, and
delete the original if you're happy with the result.
***
## Editing Existing Charts
To modify a chart that's already on your dashboard:
1. Right-click the chart (or click the menu) and select **Edit**.
2. The chart builder opens with your existing query and configuration.
3. You can change the SQL, switch [chart types](/logs/analytics-custom-charts#chart-types), adjust configuration, or use [AI Query](/logs/analytics-custom-charts#using-ai-query) to iterate.
4. Click **Save Chart** to apply your changes.
If you want to experiment without risking your current chart, use **Duplicate** first. Edit the copy, and
delete the original if you're happy with the result.